

3 Binary Options Trading Signals Most Traders Suck At
Now I’m sure most of you reading this have heard about computer programs or algorithms that send out binary options trading signals indicating which ones to trade and make money on. Let me tell you, I would stay away from these programs in general if you don’t need them. For one, if anyone has come up with a program to make money in these markets, they are not sharing it with you or I.
The only trading signals that I have been able to come up with during my 20 years in these markets is look at the charts and do my homework. It takes a lot of hard work and study to be successful. There are no shortcuts and no easy way out. If anyone is reading this and is looking for a shortcut, then I’m sorry this site isn’t for you. As a trader I have won and lost, but you keep kicking and make more than you lose. It’s that simple!
There are three important binary options signals you should take into consideration when you’re actively trading:
- Watch for Binary Options Trading Signals in Important News
- Know How to Trade the News
- Use the Price Chart as Your Ultimate Signal
1) Watch for Binary Options Trading Signals in Important News

Identify the day’s particular news items and announcements. Each day I post the events that you need to pay attention to the news section. Here is an example from a posting:
- 1010 Italian 10 Year Note Auction 4.48% prev (Euro)
- 1315 ADP Non-Farm Employment Report 165k forecast 215k prev (USD)
- 1330 US GDP 1.1% forecast 3.1% prev (USD)
- 1530 Crude Inventories 2.583M forecast 2.813M prev (Crude Oil)
- 1530 Gasoline Inventories -0.108M forecast -1.738M prev (Crude Oil)
- 1915 US FOMC Announcement 0.25% forecast (USD, Gold, all markets)
- 2000 New Zealand Interest Rate Decision 2.50% forecast (NZD)
- 2350 Japan Industrial Production 4.5% forecast -1.4% prev (Yen)
Each item has the time that it is released. The time is GMT or London time, so you’ll have to adjust the time to your particular time zone. The second thing you’ll notice is the name of the release with the forecasted expectation and the previous actual result. This allows you to know what most analysts are expecting for when the data is released and what the previous release was. This way you know when the data comes out if it’s better than expected, worse than expected or in line with expectations. You’ll also know how the data compared to the last release and is the current release better than the previous, worse than the previous release, or the same as the previous release. Lastly, you’ll see the asset that will be the most affected when the release happens.
2) Know How to Trade News Related to Your Binary Options
How do you actually trade the news release using binary options? Let me show you with a few examples below.
- After the US released disappointing GDP figures, the release came in at -0.1% versus a forecast of 1.1%, the following markets reacted at 1330 GMT.
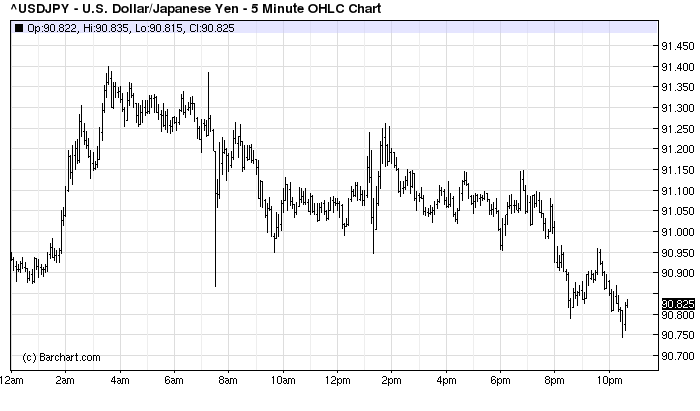
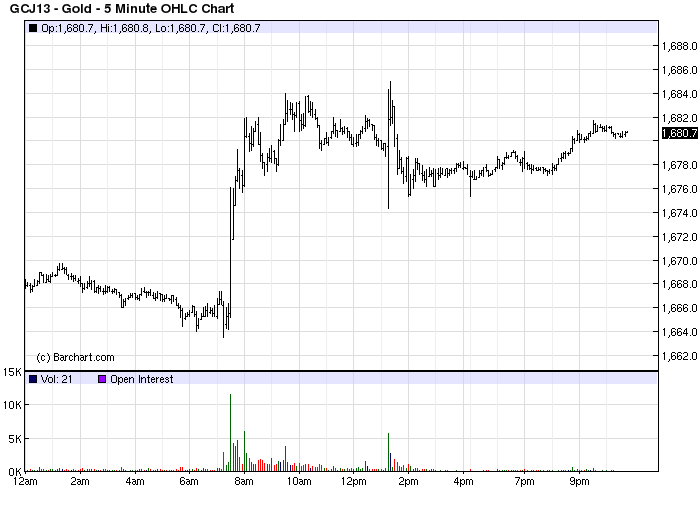
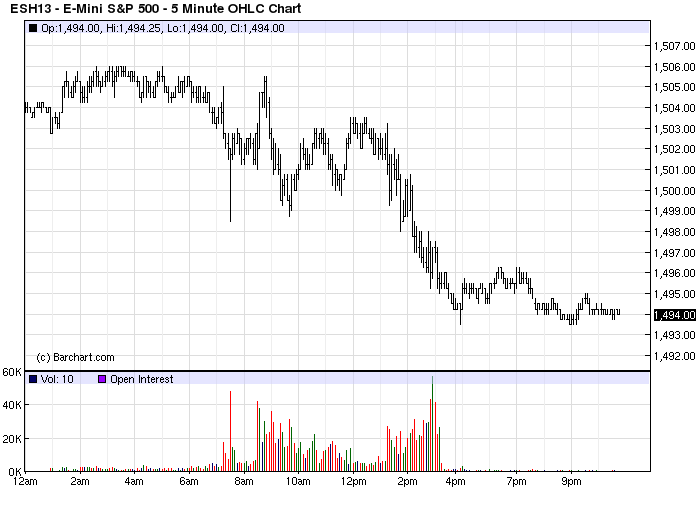
Now in looking at the above 3 charts, you can see that there was a dramatic move after the GDP figures were released at on this chart 730am central time.
1st Chart – USD/JPY
The first chart is the USD/JPY cross. One of the best ways for binary traders to trade a news announcement is to look at the chart and trade Boundary or Range options. The secret here is to take the price range on the 5 or 10 minute bar on the chart and do a break(Out) of this price range. On this particular chart, the 10 minute range was a high of 91.280 to a low of 91.196. That’s your range and that’s where the prices then broke down after the news.
The overall news item was bearish for the US dollar and that’s why it weakened against the Japanese yen. What happened after the report is the market retraced higher for the next hour and then continued to make its way lower as the fundamentals for the US dollar had weakened after the dismal GDP figures.
2nd Chart – Gold Futures
In the second chart you have Gold futures. The data signaled that the US economy is still weak and that the Fed will have to continue to support the weak economy, which is bullish for gold prices. As you can see, gold reacted positively to the news and all you had to do was buy gold Calls or High options as you can see the market was set to go higher. This gold trade is about as easy a layup as you get in these markets.
3rd Chart – S&P 500 Futures
In the third chart you have the S&P 500 futures. They spiked lower after the release and then recovered and consolidated before finally heading lower by the end of the day. This market would have been tough for binary traders to make money. I’m illustrating this example for you to see that you have to look at multiple markets after a news release and determine which one is moving and the best one to trade. That will come with more experience and looking at the various setups that occur in the markets.
Next Chart: Gold
Now looking at the following gold chart, we’re seeing what happened after the FOMC announcement at 1915 GMT or 115pm Central Time. Gold price is influenced by monetary policy more than any other asset, so anything related to Central Banks will have a profound effect on prices.
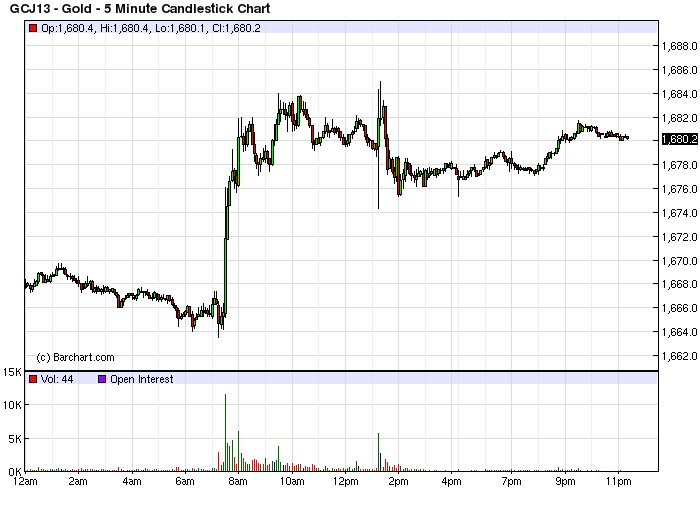
As you can see, the market had a $10 range once the announcement was made, from $1674.30 to $1684.30. The key here is that it was a green candle, so you had more buyers than sellers after the announcement. A common trade in this scenario is once you determine the candle, in this case a green candle, but a Touch option that the market will again touch the high of the move. As you can see after the move, the market did indeed touch $1684.30 again.
3) Use the Price Chart as Your Ultimate Signal

In the end the only signal that you can rely on is what the chart tells you. The chart is your guide because it gives you prices and binary options are all about price. By using price charts and price patterns, you can steer yourself to profitability.
Another key point to remember is psychological numbers in trading binary options. If you’ve been trading on the charts long enough, you’ve noticed the odd behavior that prices will have a tendency to exhibit when a ‘round’ number (prices such as .9900 or .9800 on AUDUSD) is seen. As human beings, we have a tendency to value simplicity, and our own internal psychology plays a large role with the odd price behaviors that may be exhibited at these ‘psychological levels.’
Traders will often call these whole number intervals ‘double-zeros,’ as these prices are at even numbers such as 1.31000 on EURUSD, 1.57000 on GBPUSD or 132.00 on GBPJPY. Some traders will even take this a step further by looking at the number directly in the middle of these whole numbers or ‘the fifties.’ These levels, such as 1.31500 on EURUSD or 131.50 on GBPJPY can often come into play in the same manner as the ‘double-zeros.’ This is why these prices can work so well as support and resistance. Because people (traders) watch, and care about these prices. Not every one of these prices are going to function as support or resistance, but enough do that these levels warrant the trader’s attention.
In general, round numbers such as 1.30000 on EURUSD or 1.0000 on AUDUSD or USDCAD will garner more attention than a more pedestrian level like 1.31000 on EURUSD; so many traders will often assign a higher degree of strength to the more rounded-intervals. In general, round numbers such as 1.30000 on EURUSD or 1.0000 onAUDUSD or USDCAD will garner more attention than a more pedestrian level like 1.31000 on EURUSD; so many traders will often assign a higher degree of strength to the more rounded-intervals.
This same thinking applies to stocks and commodities. Stocks usually see increased buying pressure once a stock crosses $100. Large funds come into the market above this key level. Look at crude oil $80, $90, $100, etc. Gold $1600, $1700, $1800. Silver $30, $31, $32. Corn $7, $8. I can go on and on. Key is be aware of these numbers and trade accordingly.


